Kubernetes troubleshooting and automation using Robusta
Today, I had a few minutes to take the less then 100 seconds challenge to install Robusta, an open source platform for Kubernetes troubleshooting and automation with some pretty cool integration options like Slack, Teams, etc …
Robusta is capable of handling application error (ex. Java), track kubernetes changes (ex. scaling event) and more. Alerts are sent to Slack and or available in the Robusta UI.
All testing was done on a 5 node AWS EKS cluster with the Calico add-on for network policy support.
Even when you think everything is working fine, Robusta will highlight issues in your cluster.
Getting Robusta up and running
The installation is straightforward and based on HELM templates as described here https://docs.robusta.dev/master/installation.html. So I refrained from copy/paste that information.
I must admit getting the robusta-cli running on my Mac or Linux jumpbox was challenging. So I gave up (probably way to quickly) and used a docker container to run the cli.
Create the Dockerfile
FROM ubuntu:latest
RUN apt-get update && apt-get install -y python3
RUN apt-get -y install python3-pip
RUN pip3 install -U robusta-cli --no-cache
WORKDIR /data
ENTRYPOINT ["robusta"]
Build the container
docker build -t robusta .At this stage I was ready to install everything smoothly.
helm repo add robusta \
https://robusta-charts.storage.googleapis.com && helm repo update
Next we need to generate Robusta configuration file. This is where I used the docker container image I just created.
docker run -it -v $PWD:/data robusta gen-configNow you get prompted for information about your clustername, what integrations to enable, etc . Also, carefully enable the slack integration.
When completed, a basic generated_values.yaml file is stored in your current directory containing information used to install Robusta in your cluster.
helm install robusta robusta/robusta -f ./generated_values.yamlAt this point, everything is up and running !!!
Playing with Slack and Alerts
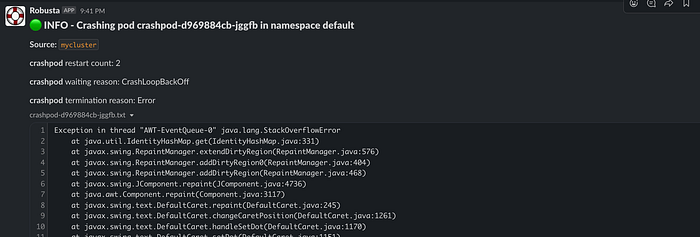
The website includes an example to create a crashing pod. Deploying this pod will trigger an alert with a whole list of Java exceptions.

Next, I added some aditional triggers to the configuration. This is done adding a few lines at the end of the generated_values.yaml. Just add:
customPlaybooks:
- triggers:
    - on_deployment_update: {}
  actions:
    - resource_babysitter:
        omitted_fields: []
        fields_to_monitor: ["spec.replicas"]
And upgrade the helm deployment
helm upgrade robusta robusta/robusta --values=generated_values.yamlAt this point, when you for example scale an existing deployment
kubectl scale deployment/app-routable-demo/echoserver-1-deployment \ --replicas 5Robusta will figure this out and display a slack message !

Conclusion
I was actually suprised how easy it was to get it all up and running and how easy it is to customise. But even with very limited experience and custom triggers it reveils a lot of information that otherwise would go un-noticed.
Feel free to checkout other articles about kubernetes, hacking and troubleshooting at https://xxradar.medium.com. Thanks
